YaK:: Graphing MATLAB Random'ness [Changes]   [Calendar]   [Search]   [Index]   [PhotoTags]   
[mega_changes]
[photos]

Graphing MATLAB Random'ness

Or: My first MATLAB program
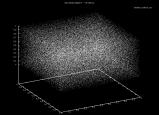
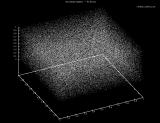
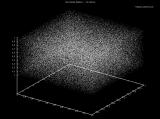
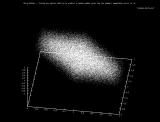
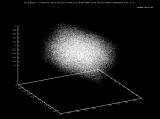
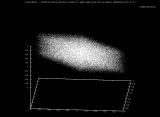
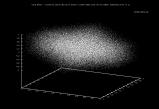
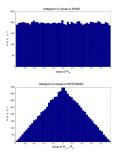
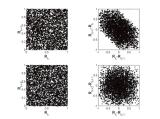
Generated by the MATLAB rand() function. Thanks to Michal Zalewski for the graphing inspiration. Each graph has 100,000 points.

The first three photos are simply graphing 3 consecutive random numbers as X,Y,Z. As we can see the numbers are pretty evenly distributed.

[Window width:   400   640   *800*   1024   1200   1600   ]
[Image size:   XS   *Small*   Medium   Large   ]


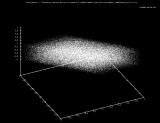
The next five images are graphing the DIFFERENCES between 3 consecutive random numbers. Ex:

  • Delta1 = Rand2 - Rand1
  • Delta2 = Rand3 - Rand2
  • Delta3 = Rand4 - Rand3 etc.

    As we can see the clustering has substantially increased. This means that given two consecutive random numbers from the rand() function we can predict the next number in the sequence without too much difficulty. With the predicted number we can predict the next number in the sequence, then the next, then the next, etc. Chance would eventually throw us off but we would need only sample two more consecutive numbers to get back on track.

    ERROR! -- Graphs are flawed -- see below.

    [Window width:   400   640   *800*   1024   1200   1600   ]
    [Image size:   XS   *Small*   Medium   Large   ]

    Apparently my first experiment wasn't as interesting as I had hoped. I had hoped doing some interesting visualization would make patterns more apparent. However, the graphs above have two errors that basically kill any utility they had -- Oh well. Moral: Random numbers are fragile creatures, careful what you do to them.

    There were two basic errors:

  • Although the random numbers are equally distributed, the *difference* of two random numbers is *not* equally distributed. Think of having 2 6-sided die and subtracting one from the other -- you have 6 ways of getting zero and only two ways of getting 5. I didn't initially realize it when I saw this, but this convergence happens to be a corrollary of the central limit theorem.

  • Going one by one when plotting creates an automatic down-ward slope in the data because a values in one point will be re-used when making the next two points. It is not obvious, however you'll discover that if all random numbers are drawn from the same distribution (in this case, between [0,1.0]), it is impossible to have to have two highly negative deltas or two highly positive deltas in a row -- much less the three highly positive/negative deltas that would be required for the 3-d plots! This can obviously be fixed simply by not allowing a single delta to be used in plotting mulitple points, but then the plot just becomes an uninteresting splotch.

    [Window width:   400   640   *800*   1024   1200   1600   ]
    [Image size:   XS   *Small*   Medium   Large   ]

  • MATLAB Source Code

    -Virgil

  • (unless otherwise marked) Copyright 2002-2014 YakPeople. All rights reserved.
    (last modified 2006-01-21)       [Login]
    (No back references.)