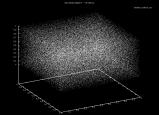
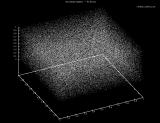
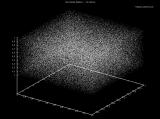
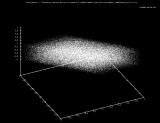
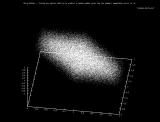
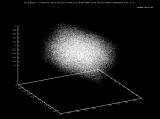
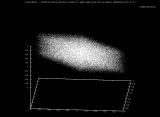
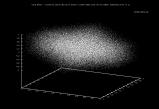
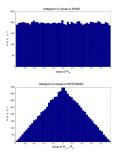
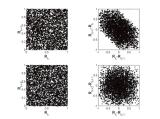
Generated by the MATLAB rand() function. Thanks to Michal Zalewski for the graphing inspiration. Each graph has 100,000 points.
The first three photos are simply graphing 3 consecutive random numbers as X,Y,Z. As we can see the numbers are pretty evenly distributed.
|
[Window width:
400
640
800
1024
1200
*1600*
] [Image size: XS *Small* Medium Large ]
|
|
The next five images are graphing the DIFFERENCES between 3 consecutive random numbers. Ex:
As we can see the clustering has substantially increased. This means that given two consecutive random numbers from the rand() function we can predict the next number in the sequence without too much difficulty. With the predicted number we can predict the next number in the sequence, then the next, then the next, etc. Chance would eventually throw us off but we would need only sample two more consecutive numbers to get back on track.
ERROR! -- Graphs are flawed -- see below.
|
[Window width:
400
640
800
1024
1200
*1600*
] [Image size: XS *Small* Medium Large ]
|
|
Apparently my first experiment wasn't as interesting as I had hoped. I had hoped doing some interesting visualization would make patterns more apparent. However, the graphs above have two errors that basically kill any utility they had -- Oh well. Moral: Random numbers are fragile creatures, careful what you do to them.
There were two basic errors:
|
[Window width:
400
640
800
1024
1200
*1600*
] [Image size: XS *Small* Medium Large ]
|
|
-Virgil
